1. Complex dashboard
1. Main Menu
Hide and show the menu by clicking this button. This allows you to free up space and view more information on your screen. On the main menu you can access all the functionality available on your account or add links to your favourites. All menu items that are white are available and all menu and items that are greyed out are not available on your account. To add a menu item to your favourites, simply click the star on the right-hand side of the menu item.
2. Select Organisation
If you have more than one organisation linked to your account, you can search and select the organisation from the dropdown menu that you want to switch to. Click on the organisation and the page will refresh and navigate to your desired organisation.
3. Logout
This button will log out the user and navigate them to the Login page.
4.User Maintenance
This button will navigate the user to the User Maintenace page where you can view the users that have admin access. Users can also easily add more users to the organisation from the User Maintenance page by simply clicking the "+" button.
5. Units - New
This button navigates the user to the "Unit Maintenance" page where he/she can quickly and easily manage their Units, Occupants, and Authenticators within the organisation.
6. Partner Invites
This button navigates the user to a page where they can easily view, accept and decline any partner invites the organisation has received.
7. "+"
Customise your dashboard header bar to suit your preferences by selecting the quick action buttons to display within the header bar.
...
This button will navigate the user to the Comb store where he/she can view and manage their device licenses and products in more detail.
2. Installer dashboard
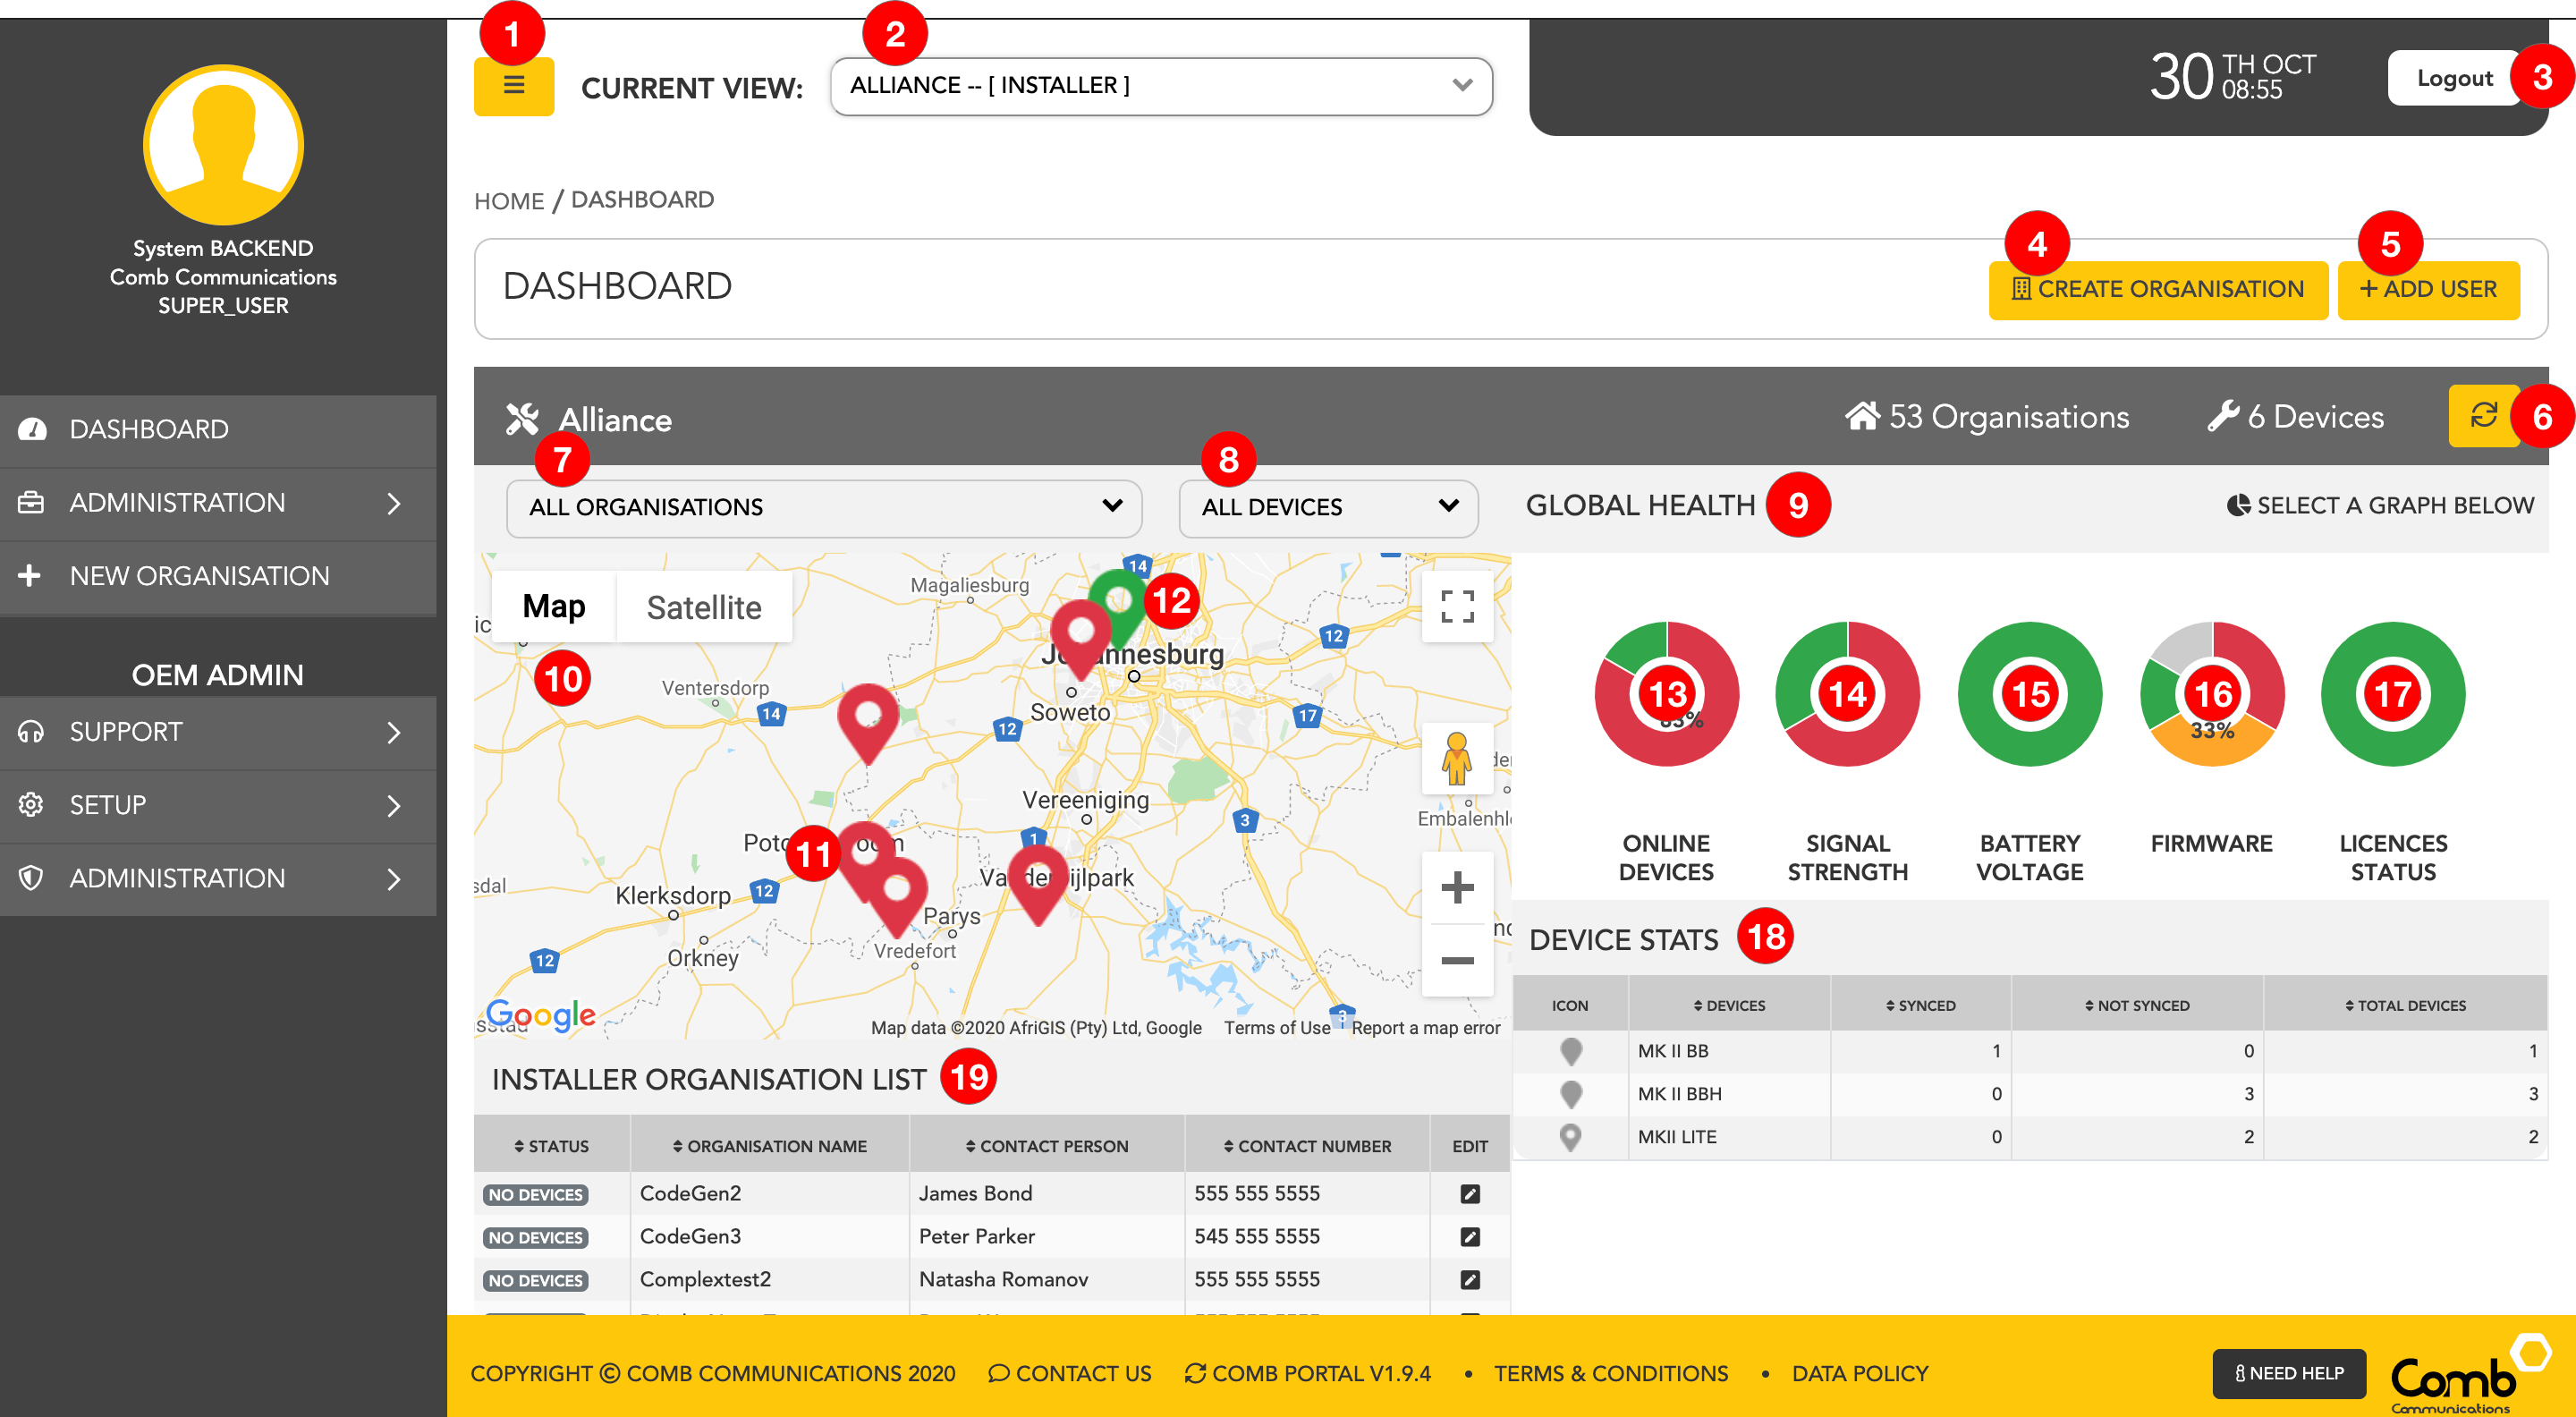
1. Main Menu
Hide and show the menu by clicking this button. This allows you to free up more space and view more information on your screen. On the main menu you can access all the functionality available on your account or add links to your favourites. All menu items that are white are available and all menu and items that are greyed out are not available on your account. To add a menu item to your favourites, simply click the star on the right-hand side of the menu item.
2. Select Organisation
If you have more than one organisation linked to your account, you can search and select the organisation from the dropdown menu that you want to switch to. Click on the organisation and the page will refresh and navigate to your desired organisation.
3. Logout
This button will log the user out of their account and navigate them to the Login page.
...
Installers can click the devices dropdown menu to search and filter the map view to display specific devices. This allows Installers to easily focus on selected devices.
9. Global health
This component displays the live status of the devices linked to the organisation. A user can simply click on a graph to open a detailed table allowing the user to view more information on the selected segment.
10. Map view
Installers are provided with a map view of the locations of their devices. The devices will be displayed in the form of a GPS marker that are colour coded based on their device status (Green indicating online and Red indicating offline).
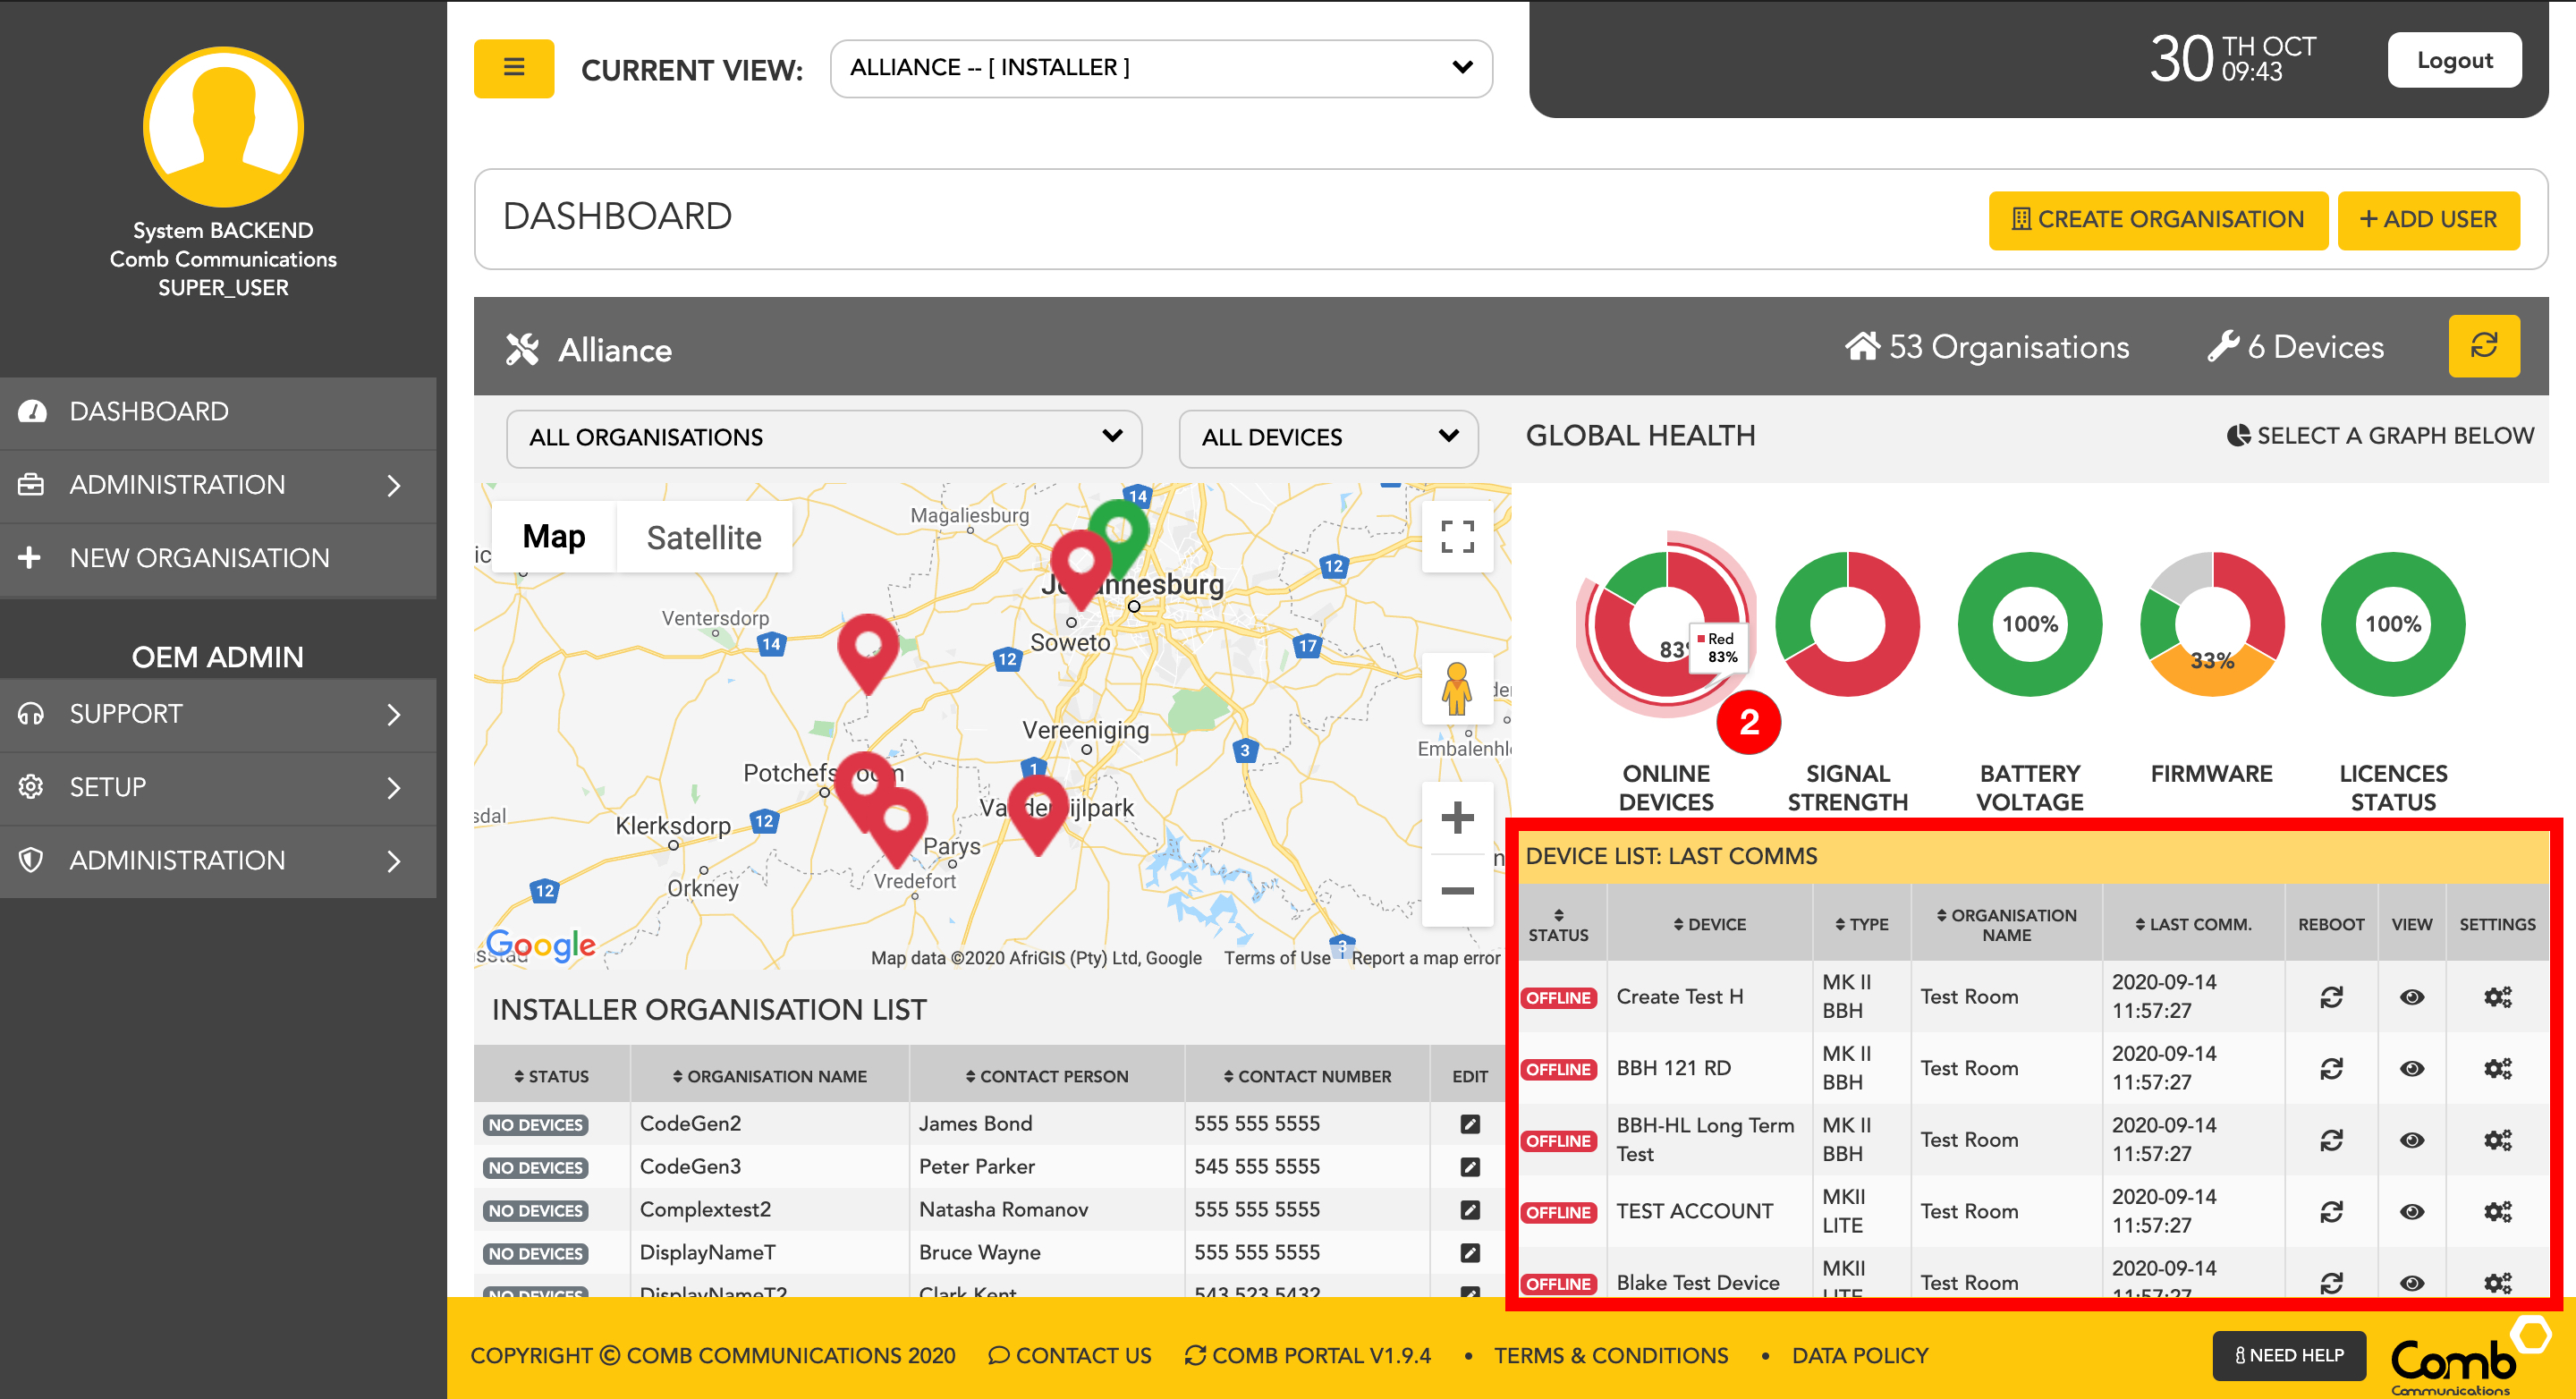
11. Red device GPS marker
This marker represents the location of an offline device
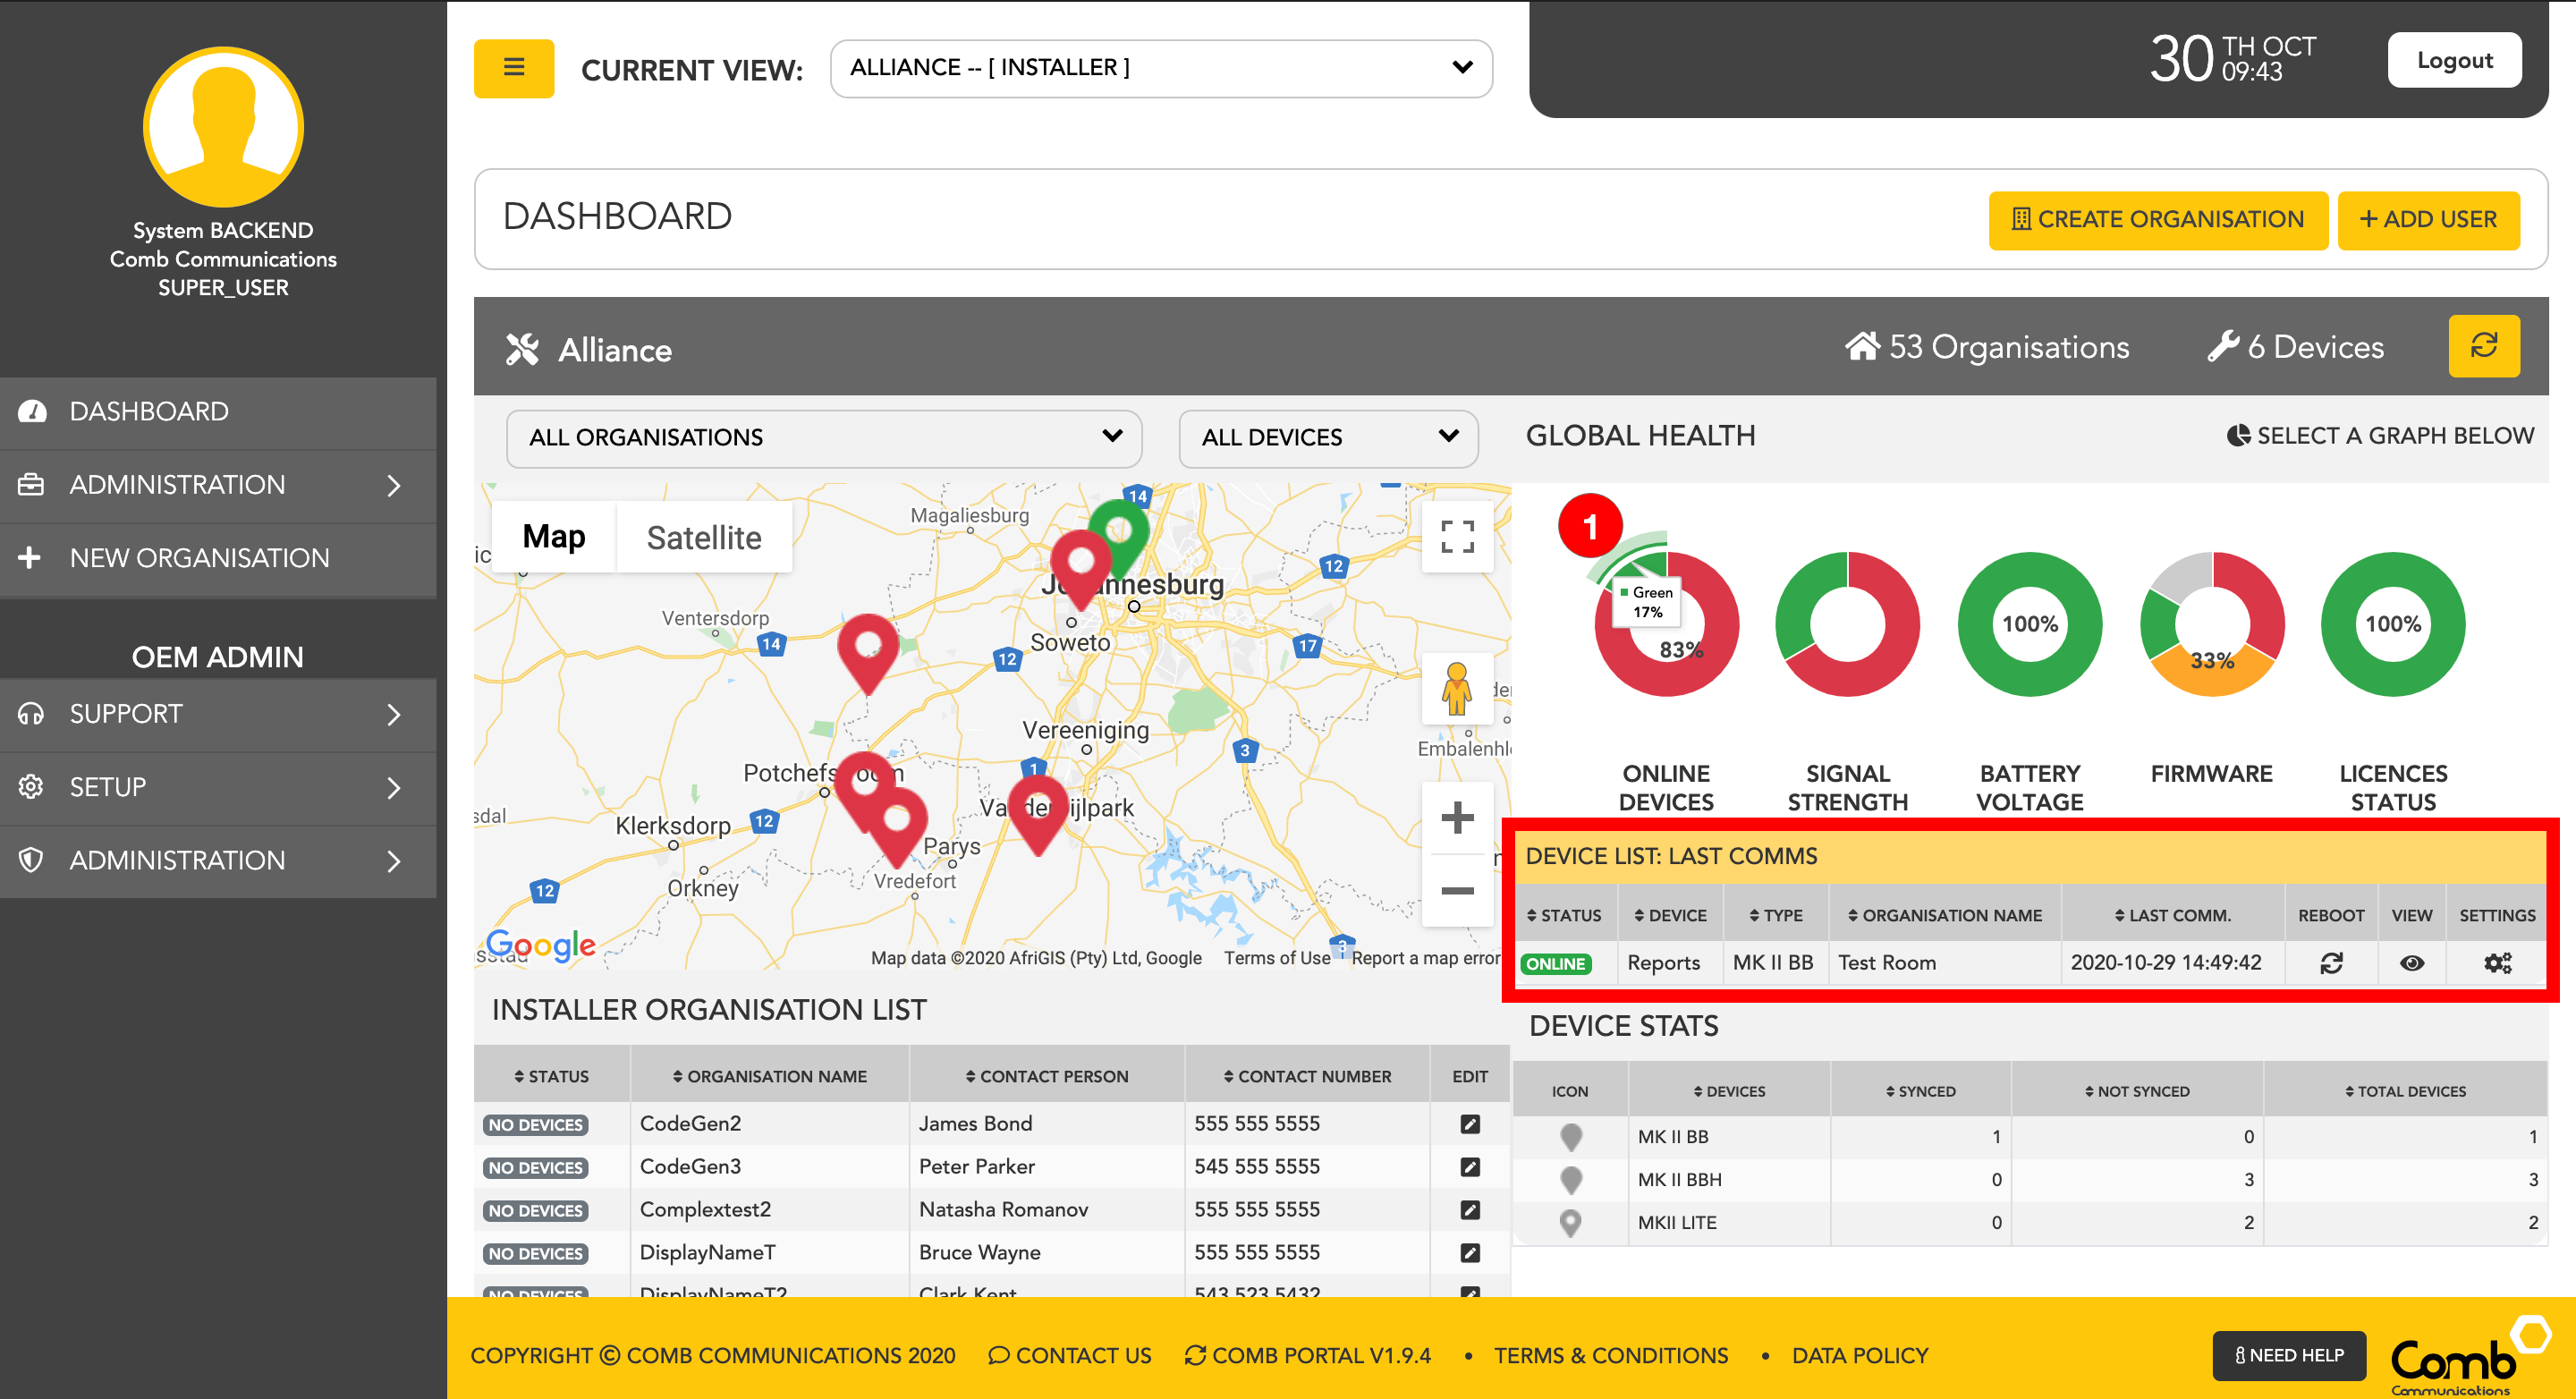
12. Green device GPS marker
This marker represents the location of an online device
13. Online devices
This pie chart represents the Installer's online and offline devices. Green indicating online and red indicating offline devices. The user can click on the pie chart segment to reveal more information on the selected segment. On the table represented, the Installer can view more information and have quick access to rebooting each device, viewing more information of each device, and configuring the device's settings.
14. Signal strength
This pie chart represents the signal strength of the Installers devices. Green indicates good and red indicates bad. The user can click on the pie chart segment to reveal more information on the selected segment. On the table represented, the Installer can view more information on the signal strength of each device and have quick access to viewing more information on each device as well as configuring the settings on the device.
15. Battery voltage
This pie chart represents the battery voltage of each of the installer's devices. The user can click on the pie chart segment to reveal more information on the selected segment. On the table represented, the Installer can view more information on the battery voltage of each device and have quick access to viewing more information as well as the ability to configure the devices settings.
16. Firmware
This pie chart represents the firmware version status of the Installer's devices. Green indicates up-to-date, Amber indicates out-of-date, red indicates not supported and grey indicating unknown. The user can click on the pie chart segment to reveal more information on the selected segment. On the table represented, the Installer will be able to view more information on each device's firmware status as well as have quick access functionality to viewing more information and live statuses of each device and the ability to update each device's firmware by clicking the settings button.
17. License status
This pie chart represents the license statuses of the Installer's devices. The user can click on the pie chart segment to reveal more information on the selected segment. On the table represented, the Installer can view more information on each device's license status and have quick access functionality to viewing more information on each device as well as the ability to navigate to the Comb store to manage your device licenses in more detail.
18. Device stats
This table represents information on the different types of devices that are linked to the Installer. The Installer can view the different types of devices that they are linked as well as how many of their devices are synced, how many are not synced and the total number of devices of each device type.
19. Installer organisation list
This table represents organisations that are linked to the Installer. From the dashboard, the installer will be able to view his organisations and their device's statuses and easily edit each of his/her organisations by simply clicking the edit button associated with an organisation. This will open the Edit organisation pop-up. Here the Installer can edit the organisations details and click "SAVE" to apply the changes.
Interactive pie chart
The user can click on the pie chart segment to reveal a table with more information on the selected segment.
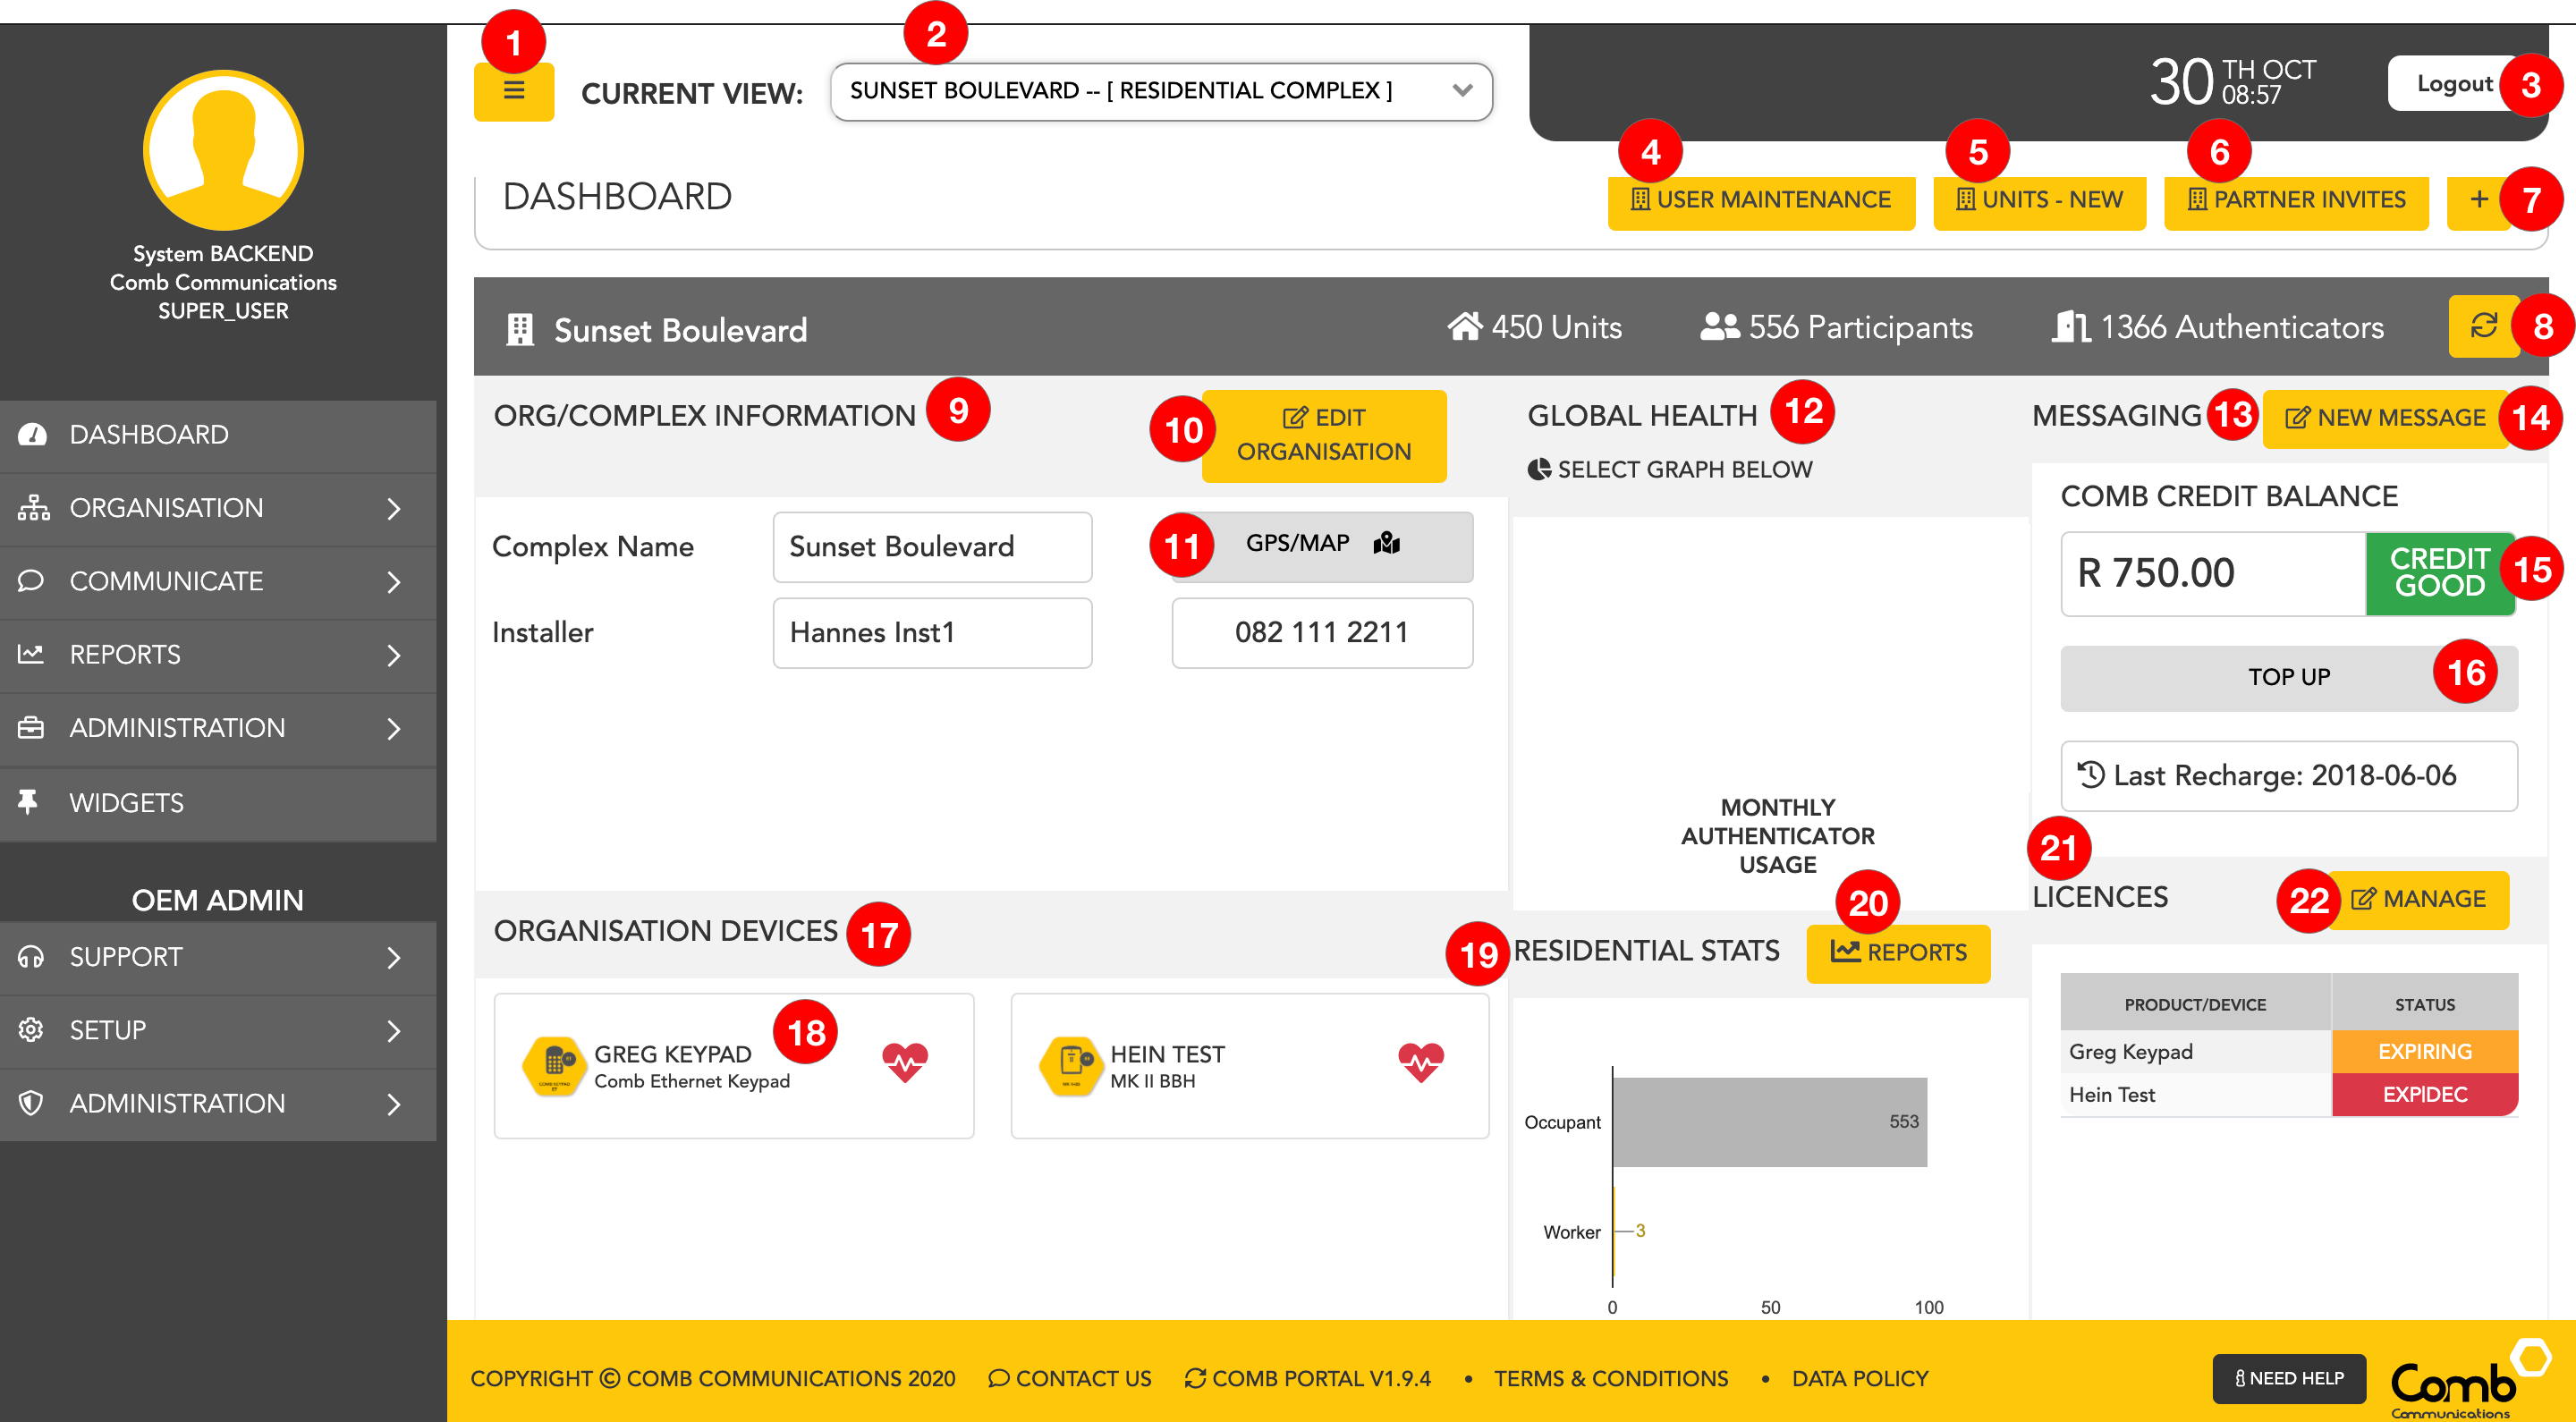
3. Management Agency dashboard
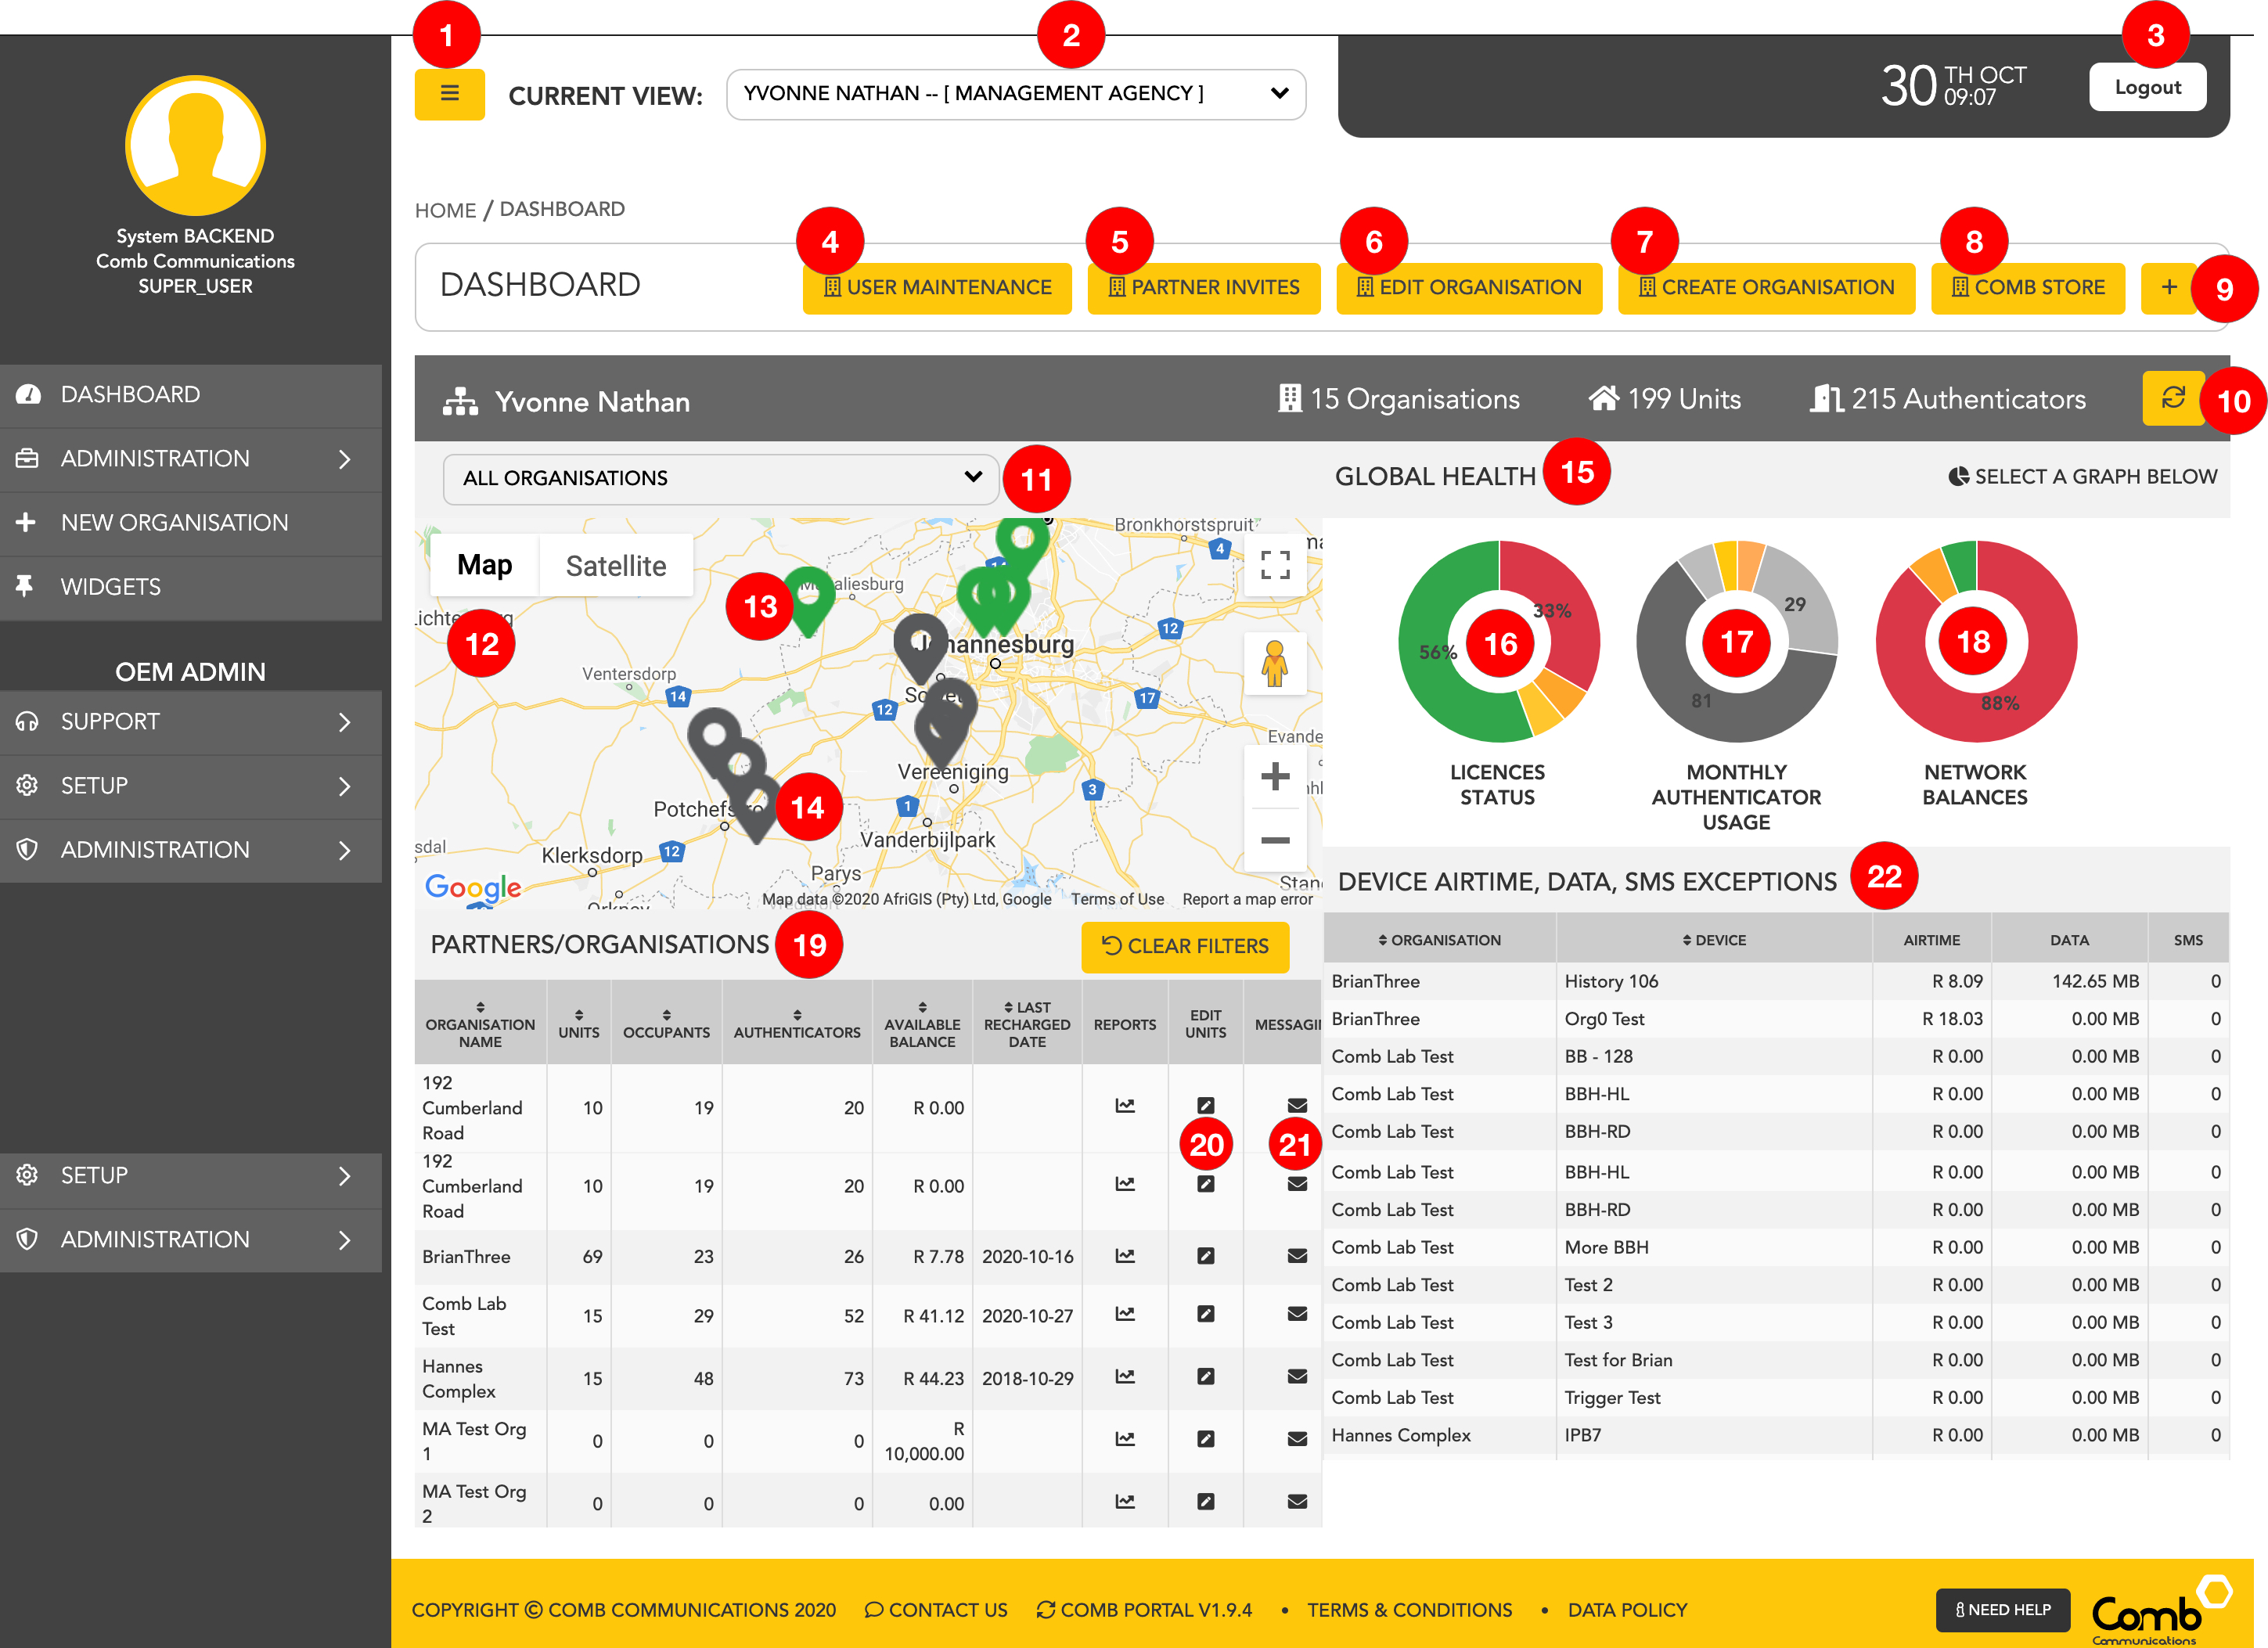
1. Main Menu
Hide and show the menu by clicking this button. This allows you to free up more space and view more information on your screen. On the main menu you can access all the functionality available on your account or add links to your favourites. All menu items that are white are available and all menu and items that are greyed out are not available on your account. To add a menu item to your favourites, simply click the star on the right-hand side of the menu item.
2. Select Organisation
If you have more than one organisation linked to your account, you can search and select the organisation from the dropdown menu that you want to switch to. Click on the organisation and the page will refresh and navigate to your desired organisation.
3. Logout
This button will log the user out of their account and navigate them to the Login page.
4.User Maintenance
This button will navigate the user to the User Maintenace page where you can view the users that have admin access. Users can also easily add more users to the organisation from the User Maintenance page by simply clicking the "+" button.
5. Partner Invites
This button navigates the user to a page where they can easily view, accept and decline any partner invites the organisation has received.
6. Edit Organisation
Click this button to open the "Edit organisation" pop-up. Here the user can edit the organisations details such as preferences, physical address, Geolocation, and postal address.
7. Create organisation
This quick action will allow the management agency user to easily create an organisation directly from their dashboard. Simply click this button to navigate the user to the Create complex page where the installer can complete the required fields to create a new organisation.
8. Comb store
The user can simply click this button to navigate to the Comb store page where he/she can manage their device's licenses.
9. "+"
Customise your dashboard header bar to suit your preferences by selecting the quick action buttons to display within the header bar.
10. Refresh
Refresh and update the dashboard by clicking on this refresh button.
11. Organisations map view filter list
Management agency users are able to click the organisation dropdown menu to search and filter the map view to display a specific organisation. This allows Installers to easily focus on a selected complex.
12. Map view
Management agency users are provided with a map view of the locations of their linked organisations. The organisations will be displayed in the form of a GPS marker and colour coded based on the organisations device status.
13. Green GPS marker
An organisation linked to the management agency user that has active devices operating.
14. Grey GPS marker
An organisation linked to the management agency user that does not have active devices operating.
15. Global health
This component displays the live status of the devices linked to the organisation. A user can simply click on a graph to open a detailed table allowing the user to view more information on the selected segment.
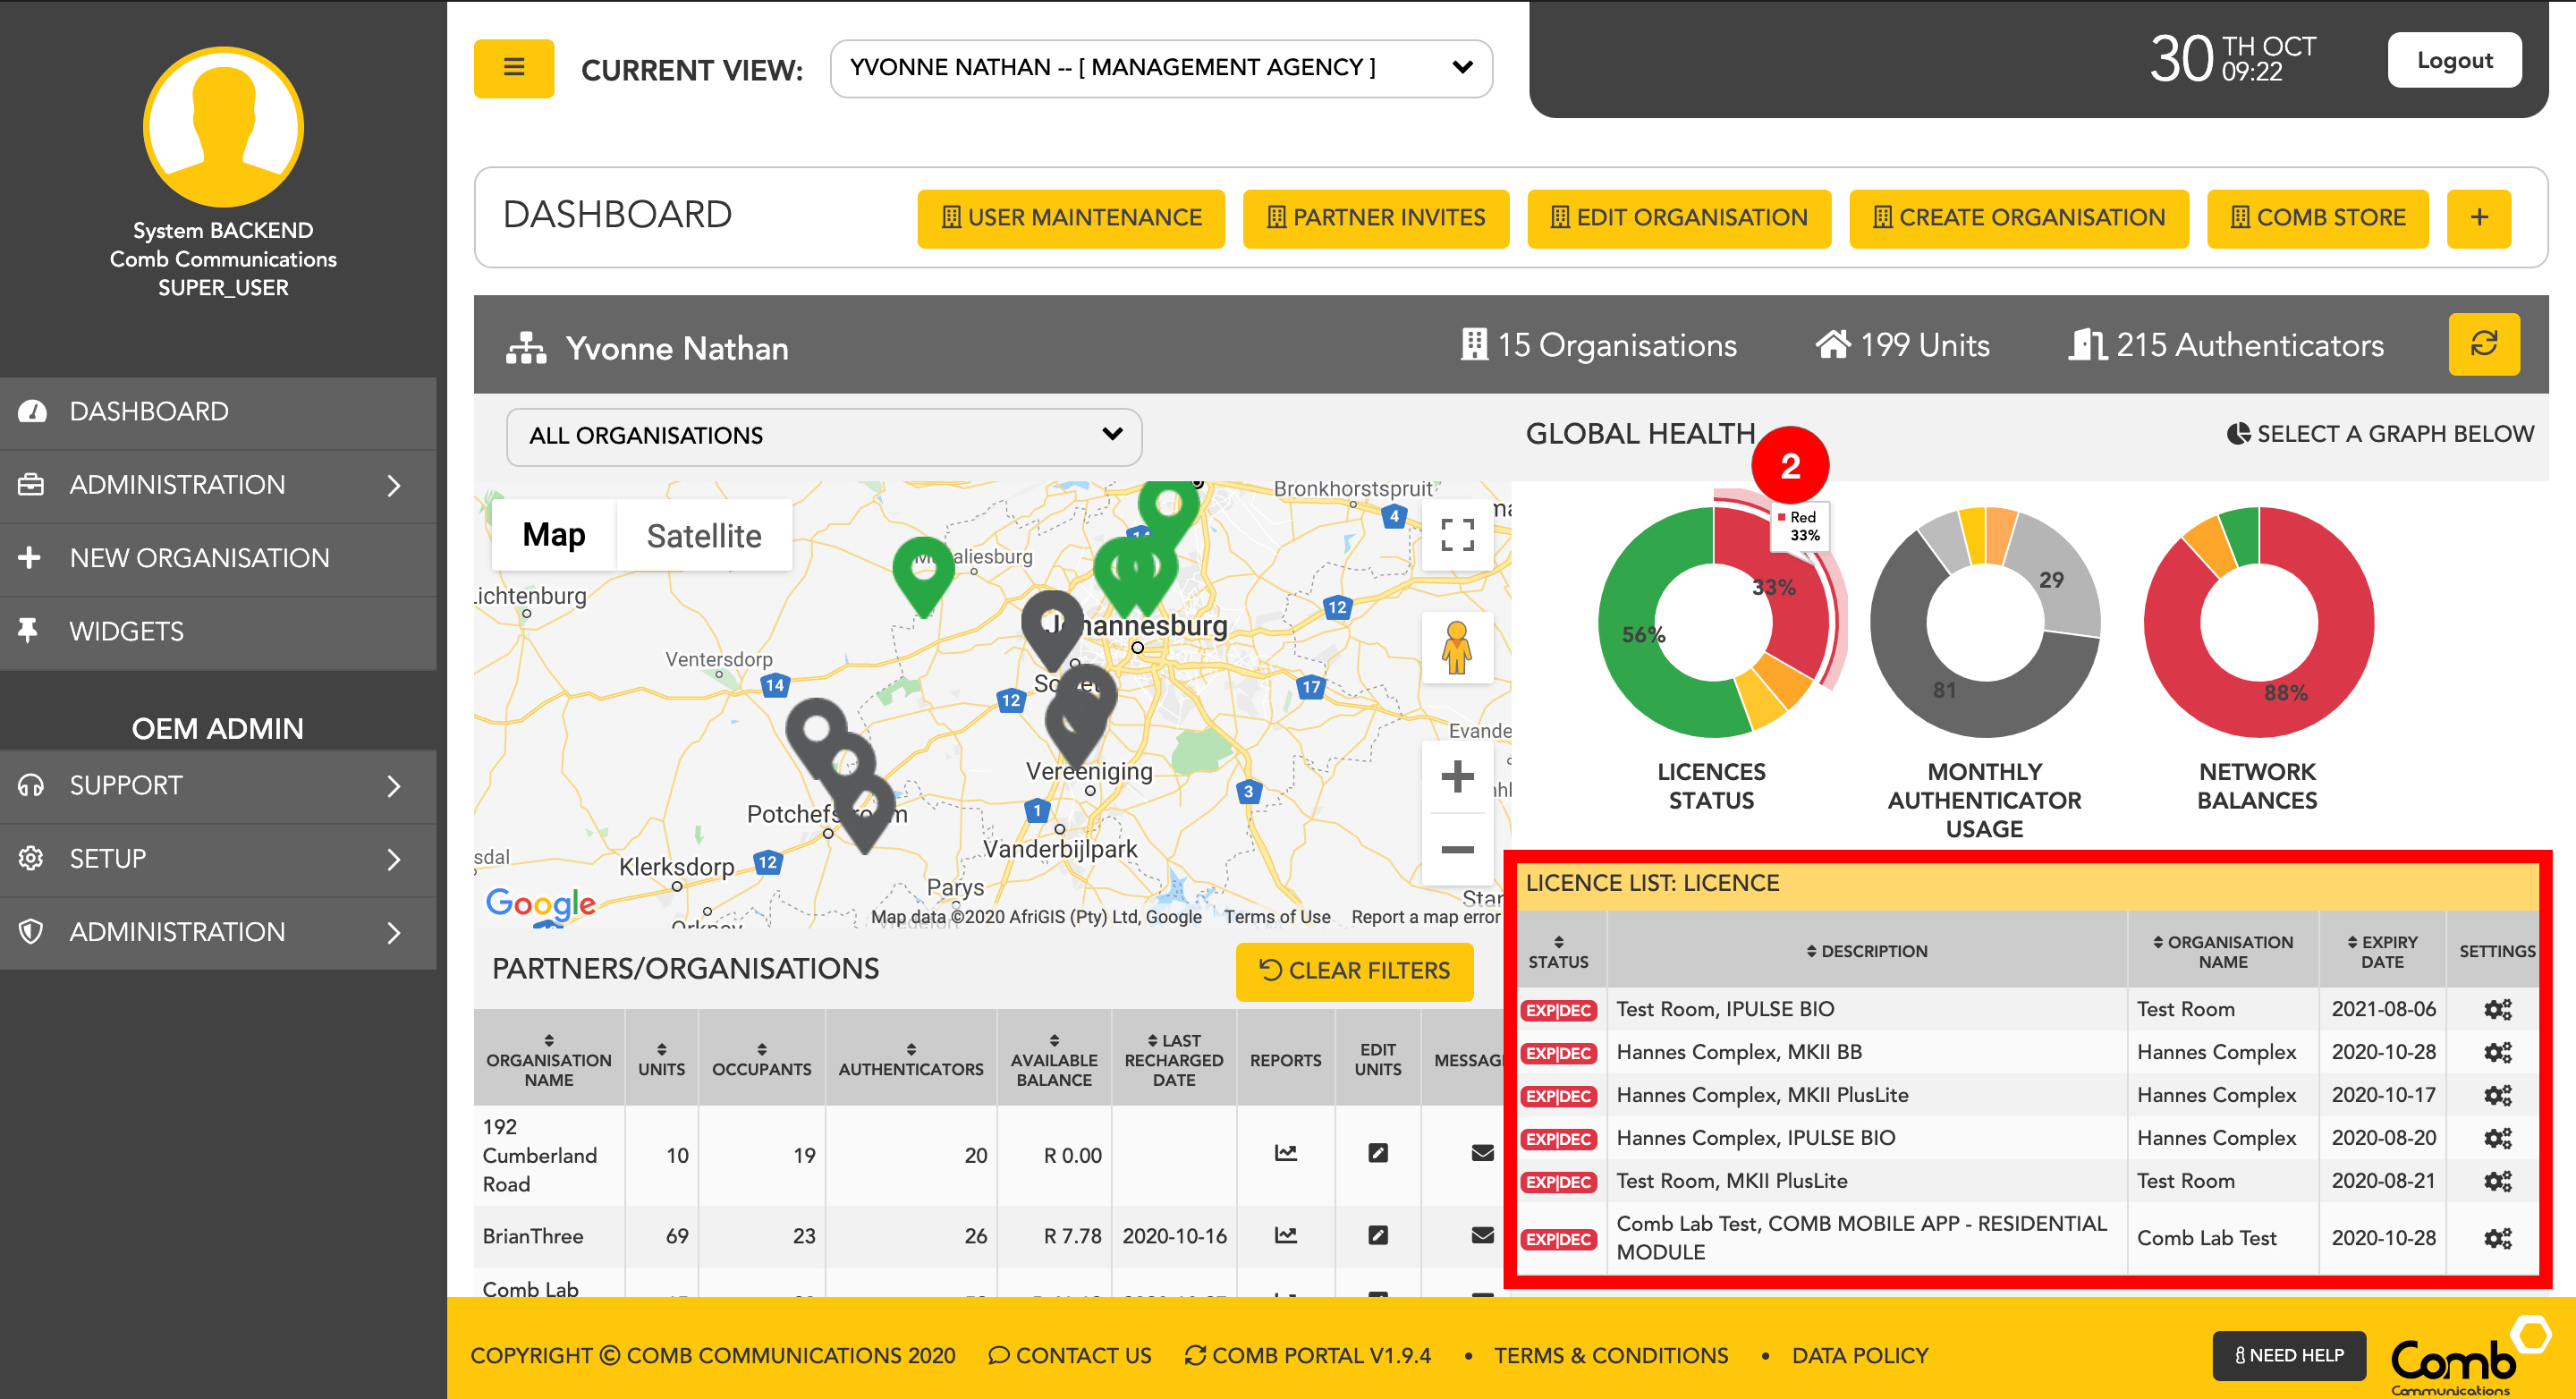
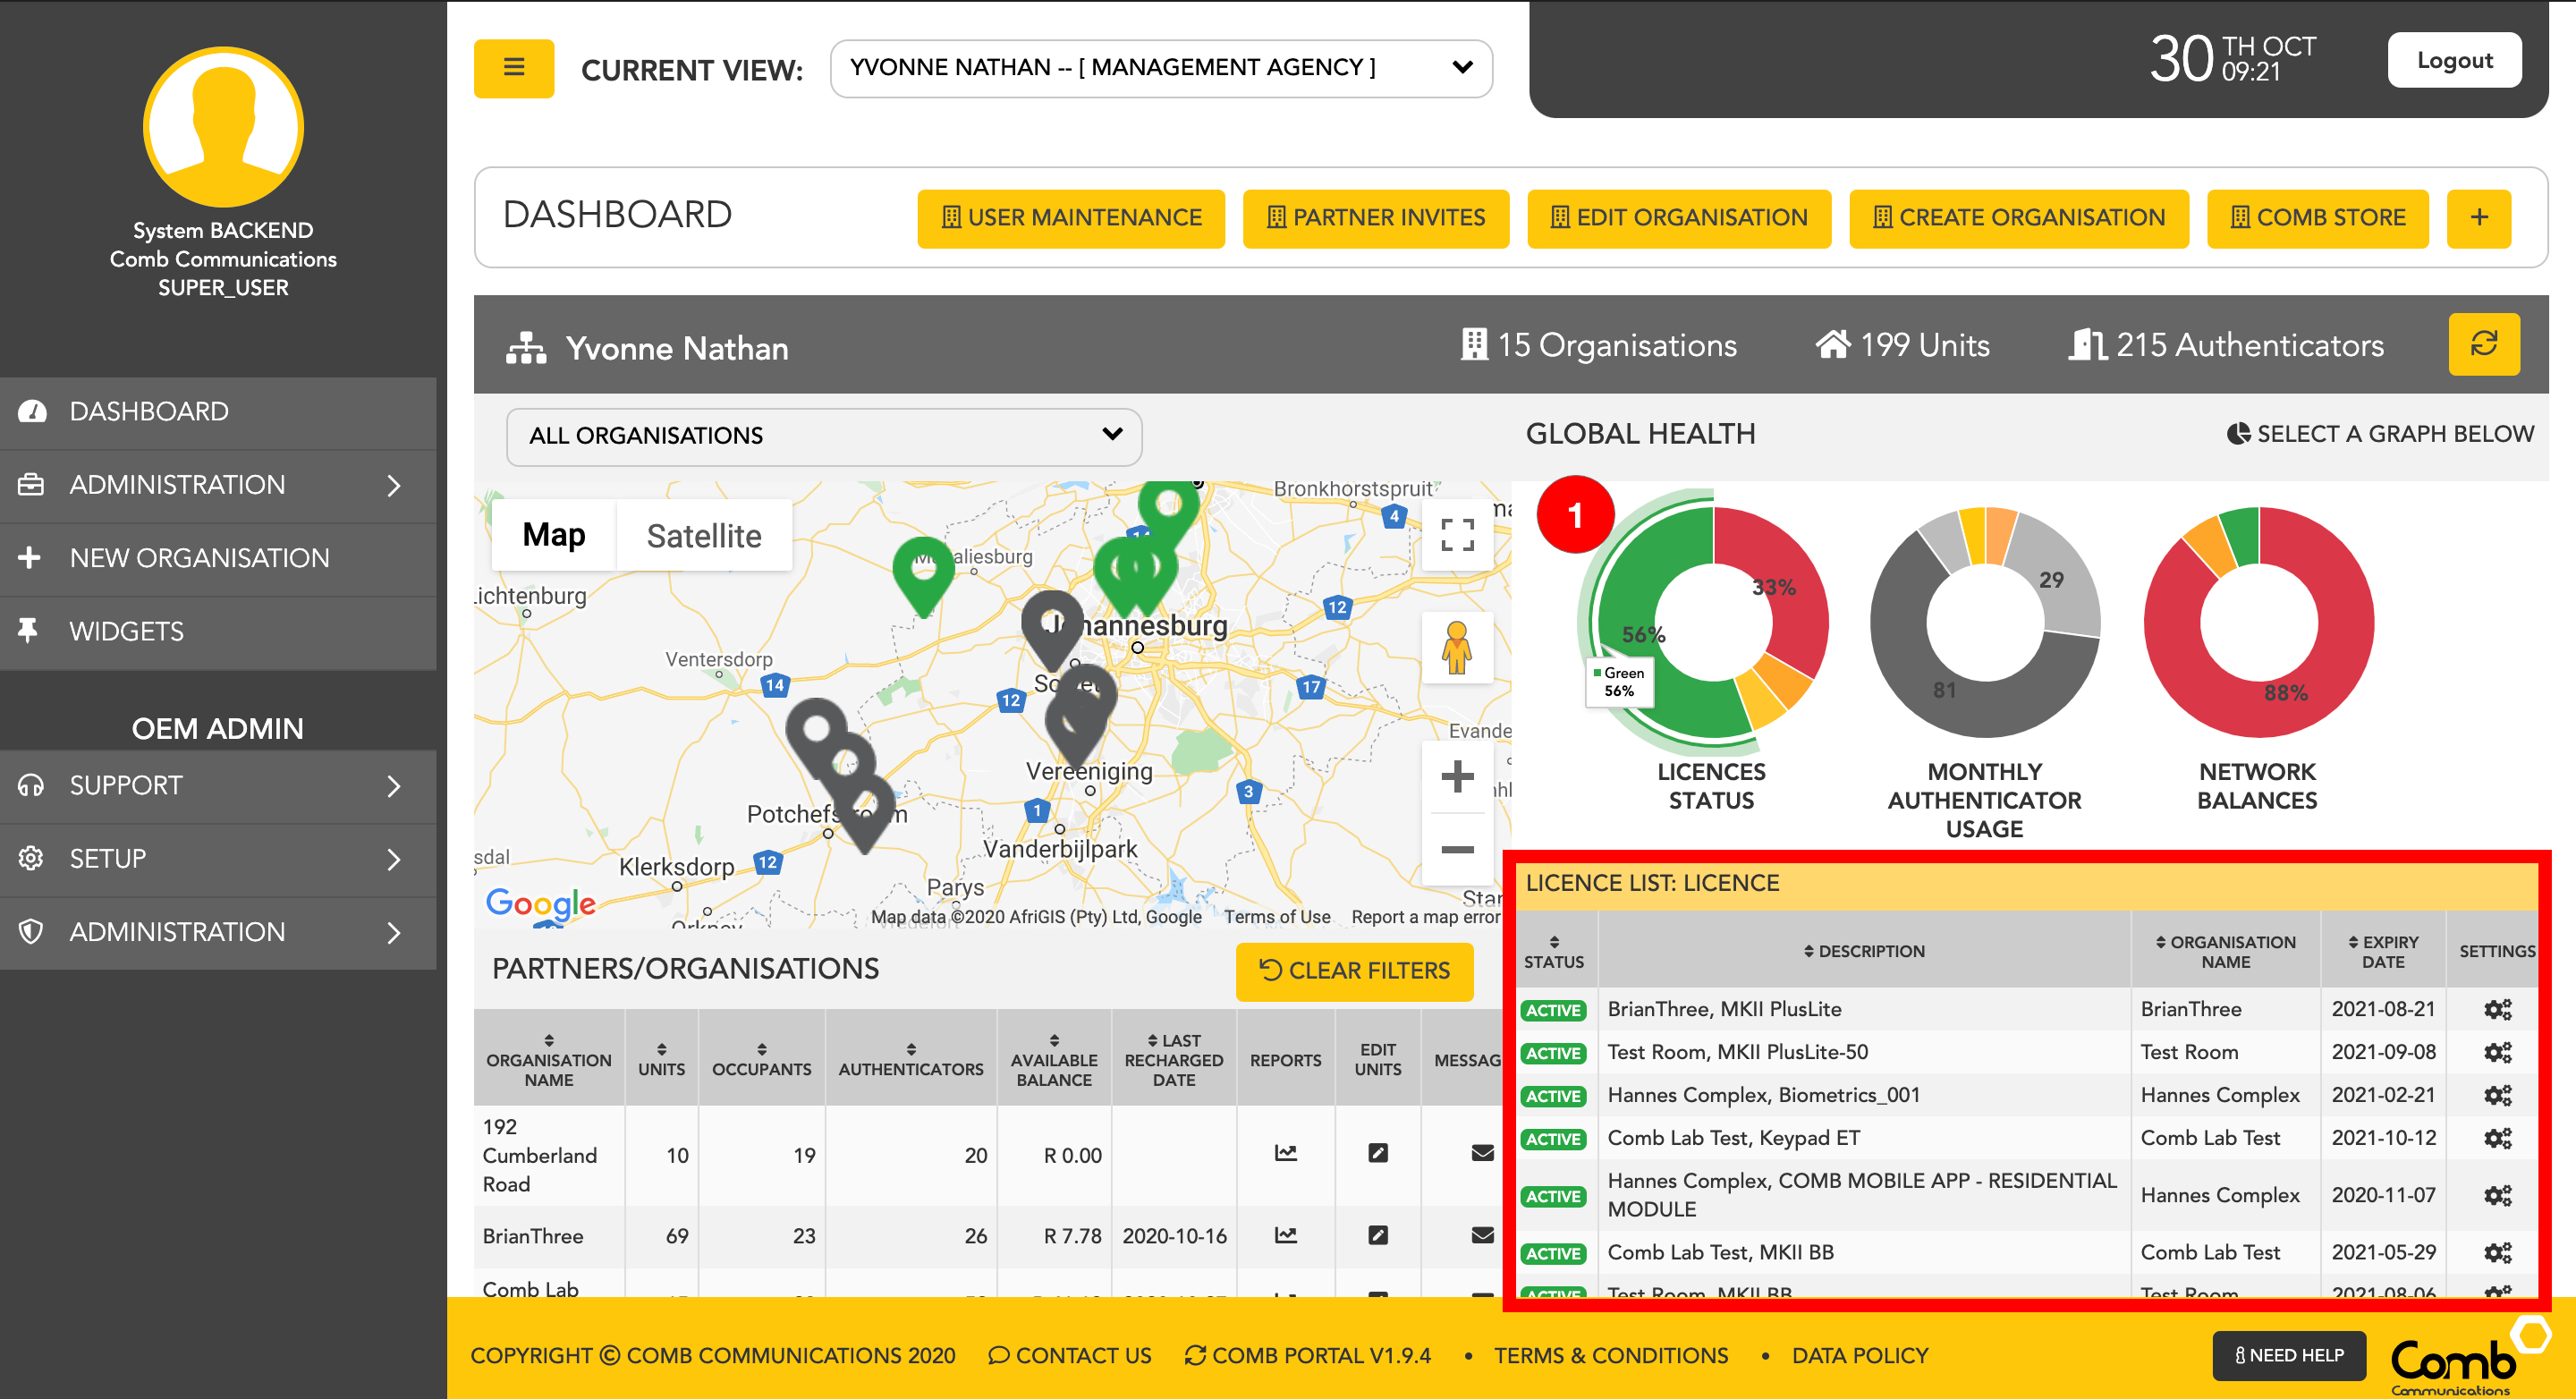
16. License status
This pie chart represents the license status of the selected organisation devices. Green indicating active licenses, amber indicating expiring licenses and red indicating expired licenses. The user can click on the pie chart segment to reveal more information on the selected segment. On the table represented, the management agency user can view more information on the devices license status as well as have the ability to navigate to the Comb store to manage the device's licenses.
17. Monthly authenticator usage
This pie chart represents the number of times the authenticators have been used in the past month at the selected organisation. The user can click on the pie chart segment to reveal more information on the selected segment. On the table represented, the management agency user will be able to view more information on the authenticators used that month at the organisation. The user will also have the ability to navigate to the Triggers page to further manage their authenticators.
18. Network balances
This pie chart represents the network balances of the organisations devices. Green indicates resources are good, amber indicating resources are low and red indicating no resources. The user can click on the pie chart segment to reveal more information on the selected segment. On the table represented, the management agency user can view the organisation's device network balances in both airtime and data forms to ensure that the credit is always topped up so that services never experience down-time.
19. Partners/Organisations
This table represents the partners and organisations that are linked to the management agency user. The management agency user can view all their organisations/partners and additional information such as available balances. The user can filter the table to easily find a specific organisation and have the functionality to: Generate reporting for each organisation, edit units, and send messages to other organisations that are linked to their account.
20. Edit unit
This button navigates the user to the "Unit Maintenance" page where he/she can quickly and easily manage their Units, Occupants, and Authenticators within the organisation.
21. Messaging
A management agency user can click on the send message button to send a message to a recipient within the associated organisation. A user can directly send a message via Email, SMS, or Mobile App. Simply click the Message icon to open the Messaging pop-up, select the messaging type, choose the recipients (either bulk messaging or individually), complete the subject and message and click the Send button to complete the process and send the message.
22. Device airtime, data, SMS exceptions
This table represents the balances of the selected organisation's devices. By selecting an organisation on the map, the management agency user is able to view how much airtime, data, and SMS's are left on the selected device's organisations. This table is displayed for management agency users to ensure that their complexes always have enough airtime, data, and SMS's to avoid any downtime services.
Interactive pie chart
The user can click on the pie chart segment to reveal a table with more information on the selected segment.